
How to Read a Player's Analysis
A career batting average tells you how good a player is. It does not tell you how to get him out. The Analysis tab is where Skipper goes past the headline number and into the patterns underneath, built from every ball the player has faced or bowled across all their matches. It is the closest thing club cricket has to the breakdown a television analyst would put up before a big game.
Where the Analysis Tab Lives
Open any player's page, your own from the Profile tab or anyone else's by tapping their name, and you will see a row of tabs across the top. Analysis is one of them, sitting alongside career stats, form, and matches. Everything inside it is read from the player's completed matches and adds up over a whole career, not a single game.
At the top is a single switch: Batting or Bowling. Tap whichever side of the player you want to study. The cards below change to match.
The Batting View
The first card is the one to read before any other. Phase Analysis splits the player's batting into the powerplay, the middle, the acceleration, and the death, and shows strike rate, runs, dot percentage, and boundary percentage for each. This is where a player's real character shows up. A strike rate that climbs from the powerplay to the death is a finisher. One that is highest early is a player who likes to take the new ball on.
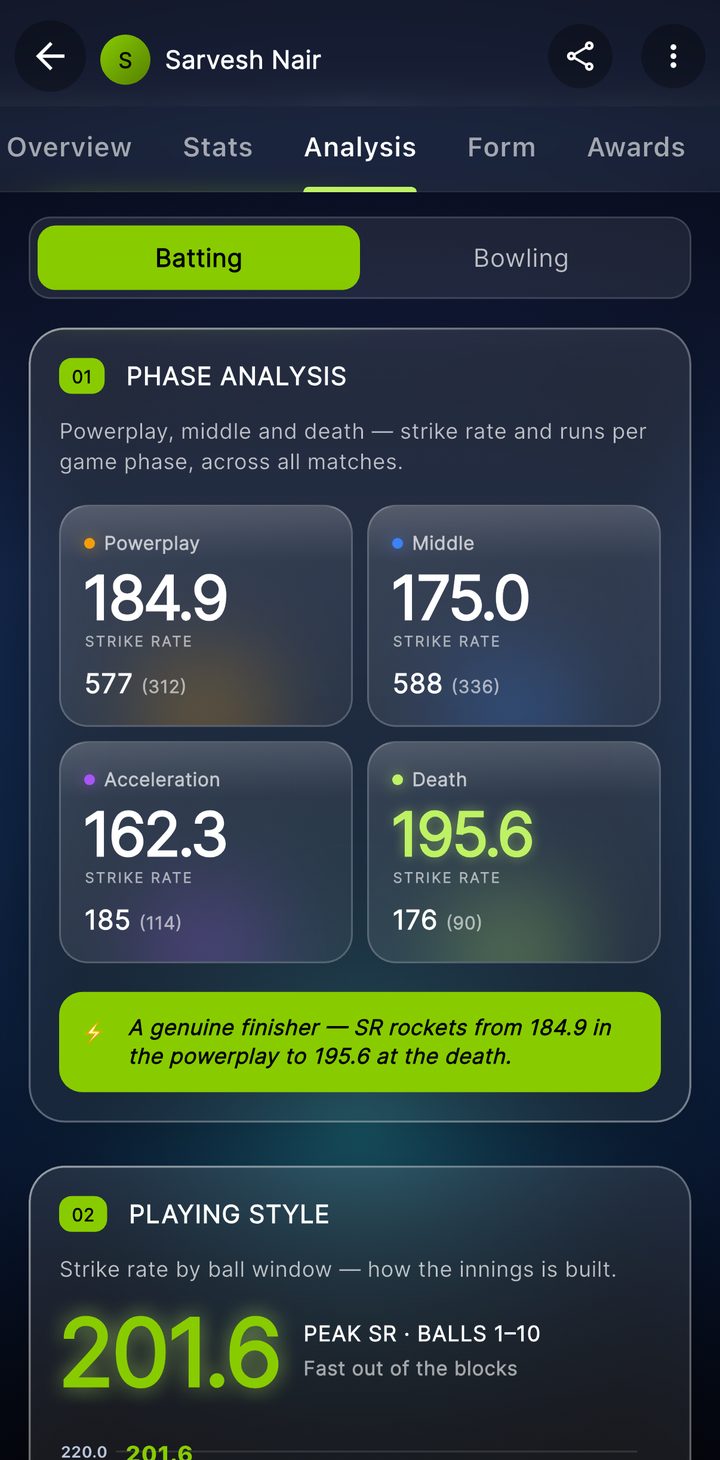
From there it gets more specific:
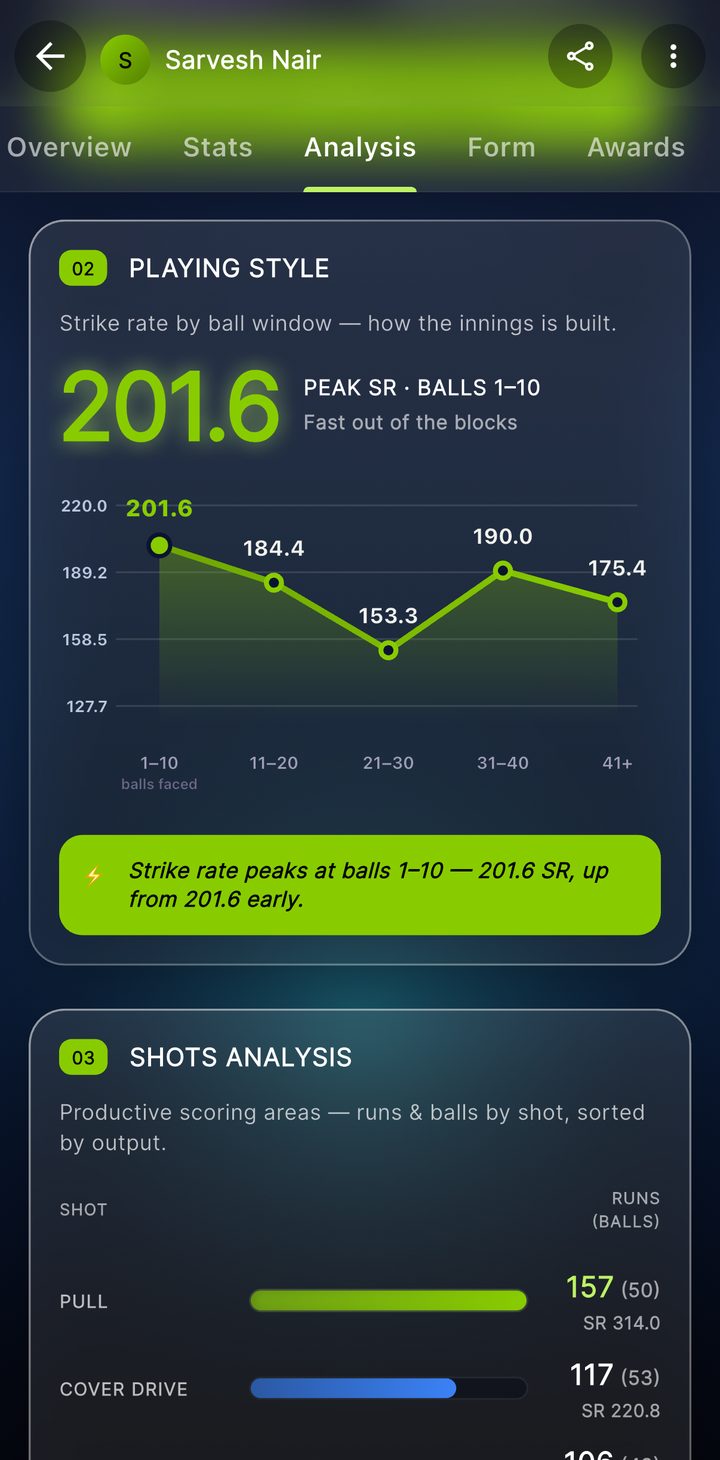
- Playing Style charts strike rate across the innings, ball window by ball window, so you can see whether a batter starts fast or builds.
- Shots and Field Zones break down where the runs come from, the cover drive against the slog, the off side against the leg, each with its own runs, balls, fours, and sixes.
- The Wagon Wheel draws that same scoring around the field, and the Pitch Map lays out how the batter does against each line and length, with the cells where the wickets fall marked out.
- Vs Bowling Types and Pace vs Spin are the matchup cards, the ones that answer "does he struggle against the turning ball." Ball Type and Pitch Type do the same for tennis against leather, and turf against matting.
- Batting Position, Performance by Innings, Type of Runs, Dismissal Types, Top Partnerships, and Stats by Period round it out, down to which partner he scores best with and how this year compares to last.
The Bowling View
Flip the switch to Bowling and the same idea turns around. Phase Analysis now shows economy and wickets across the powerplay, middle, and death, so you can see where a bowler is tightest and where he leaks. The Pitch Map shows where he lands it and which lengths bring his wickets. Field Zones and Shots Against show where batters get after him.
Two cards are bowling only, and they are the ones captains study hardest. Vs Bat Hand splits everything by right and left handers, with economy, average, and strike rate for each, and Vs Bat Position does the same across the top order, middle, and tail. If a bowler eats left handers but goes at eight an over to right handers, this is where you will see it before you set your field.
Why Some Cards Are Missing
You may notice a player has fewer cards than another. That is by design. A card only appears when there is data behind it, so nothing on the screen is padding. The matchup and zone cards, the pitch map, the wagon wheel, the pace against spin, all of those are powered by the scoring enrichments captured during a match, the shot type, the field zone, the line and length, the bowler's style. Score plain and you still get the phase, position, and innings breakdowns. Score with enrichments on and the richer cards fill in. The more matches a player has scored properly, the deeper the read.
The Analysis tab pulls from the server, so it wants a connection to load and refresh. Pull down to refresh once a match has been completed and synced, and the new game folds into the picture.
You do not need to be a coach to use any of this. Before a knockout, open the other side's danger man and look at his pitch map. Find the length he has been out to. Then go and bowl it. That is the whole point of the tab.